Search Our Database
Installing HetrixTools in Linux – Monitoring HDD/SSD/NVMe Drive Health
Intorduction
Monitoring the health and usage of your server’s storage is a critical part of system maintenance and proactive issue prevention. Disks — whether HDDs, SSDs, or NVMe — can silently accumulate wear and errors over time, leading to performance degradation or even unexpected data loss if not detected early.
By integrating HetrixTools’ lightweight server monitoring agent with S.M.A.R.T. disk health reporting, system administrators can gain real-time visibility into drive status, usage levels, temperature, and potential failure indicators. HetrixTools also allows you to set threshold-based alerts for disk space usage, ensuring you’re notified before partitions fill up and affect services.
This guide will walk you through how to install HetrixTools on a Linux server, enable disk health monitoring, and configure notifications for individual disk mount points based on your needs.
Prerequisites
Before you begin, ensure the following:
- You have a Linux server (Ubuntu, CentOS, Debian, etc.)
- Root or sudo access
- A HetrixTools account (Sign up here)
- The server is connected to the internet
Step-by-Step Guide
Step 1 – Install HetrixTools Monitoring Agent
- Log in to your HetrixTools account.
- Go to the Uptime Monitors section and click into the server you want to monitor.
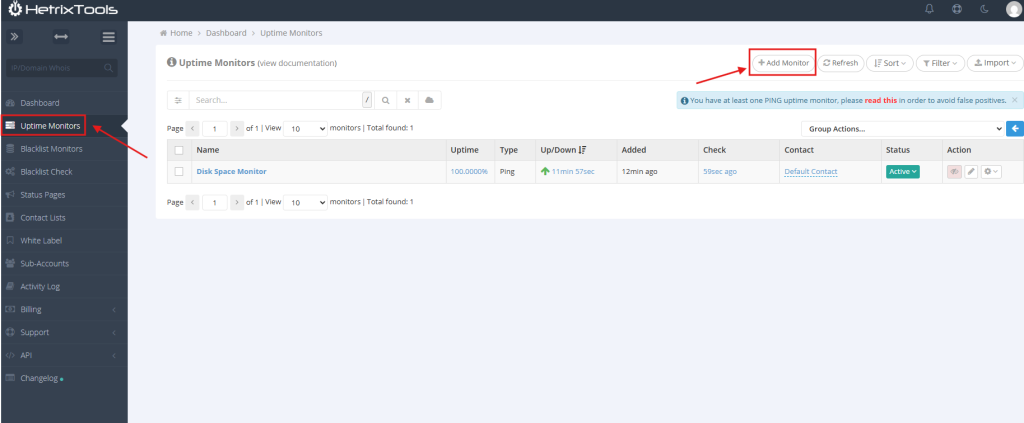
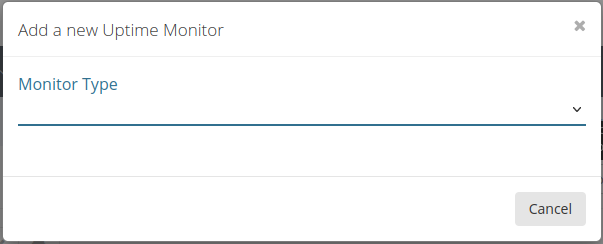
- Add a Monitor
- If you do not have any monitors set up, a prompt will appear to add your first monitor.
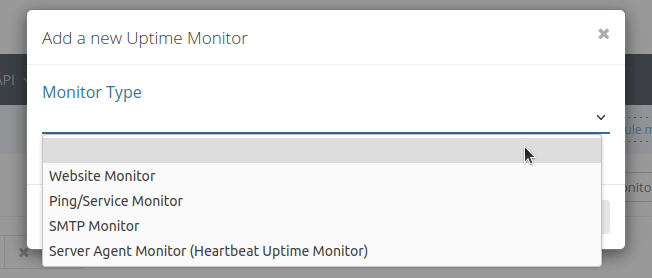
- Select Ping/Service Monitor to proceed with monitoring your server’s uptime and resource usage.
- If you do not have any monitors set up, a prompt will appear to add your first monitor.
- Click the “gear” button and click “Install Monitoring Agent” tab.
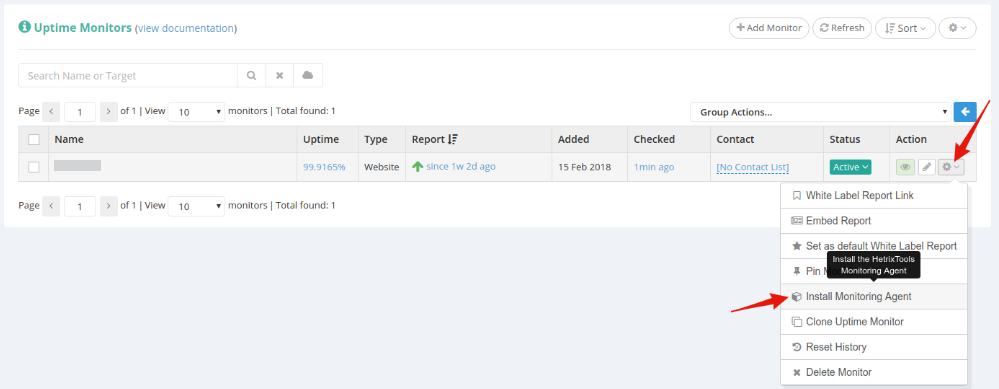

- Configure Monitoring Preferences
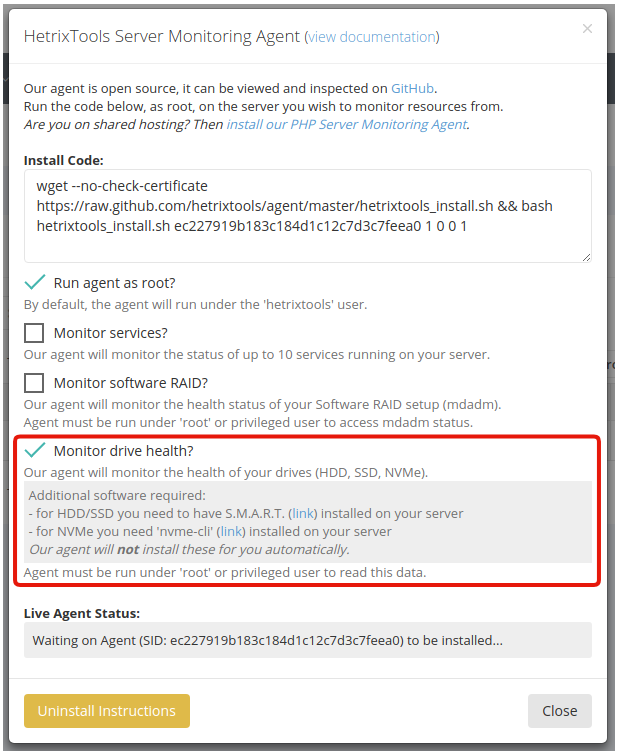
- In the Monitoring Agent Package settings, choose the specific metrics and services you want to monitor on your server.
- On the installation code pop-up modal, select “Monitor drive health?”:
Step 2 – Install the Monitoring Agent on Your Server
- After setting your monitoring preferences, an installation command will be provided by HetrixTools.
- Copy the installation command, then access your Linux server via SSH.
- Run the command on your server’s command line to install the monitoring agent.
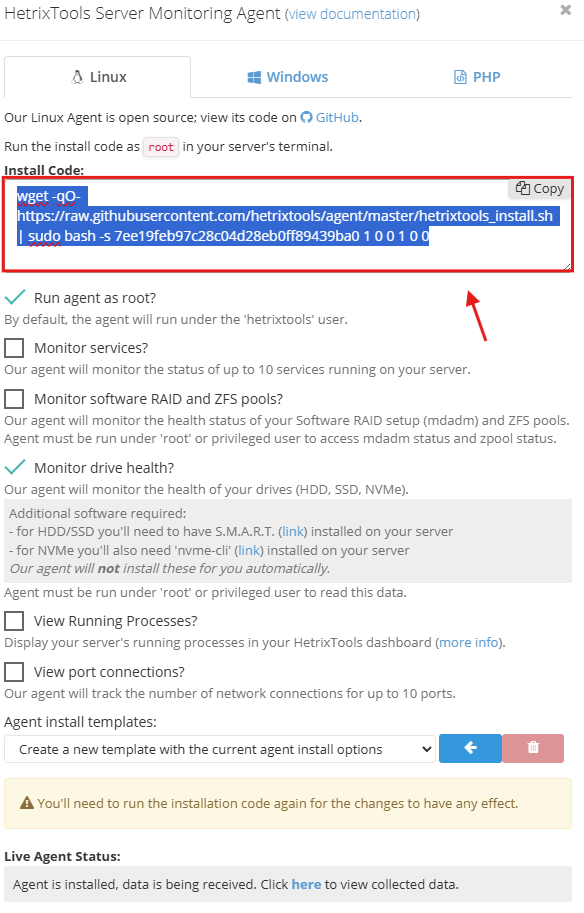 Example installation command:
bash <( curl -s https://hetrixtools.com/install/server-agent.sh )
This will install a lightweight agent that reports CPU, RAM, Disk, and Network usage every minute.
Step 3 – View Disk Health in HetrixTools
- Once enabled:
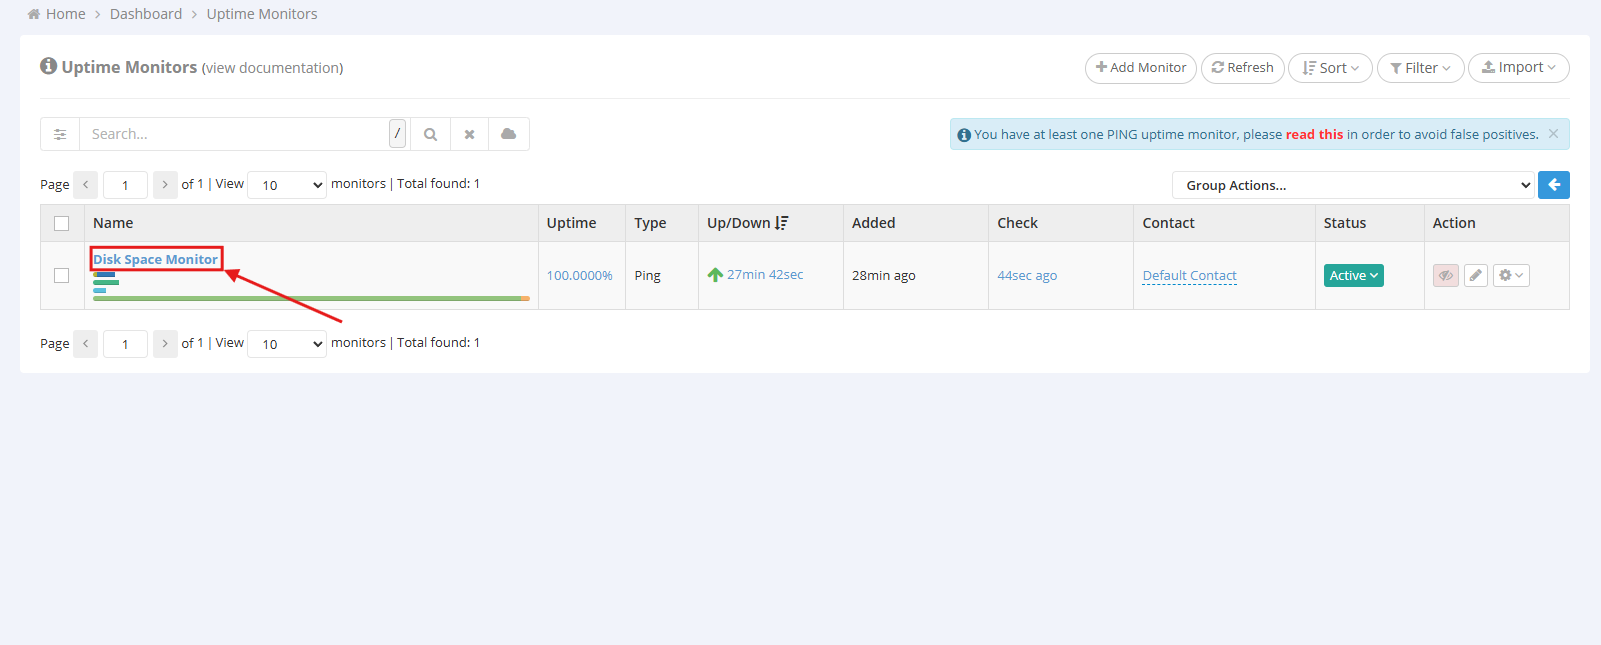
- Navigate to your Uptime Monitor in HetrixTools.
- Click on the server name tab.
- You will see details such as:
- CPU
- RAM
- Net
- Disk
- Miscellaneous
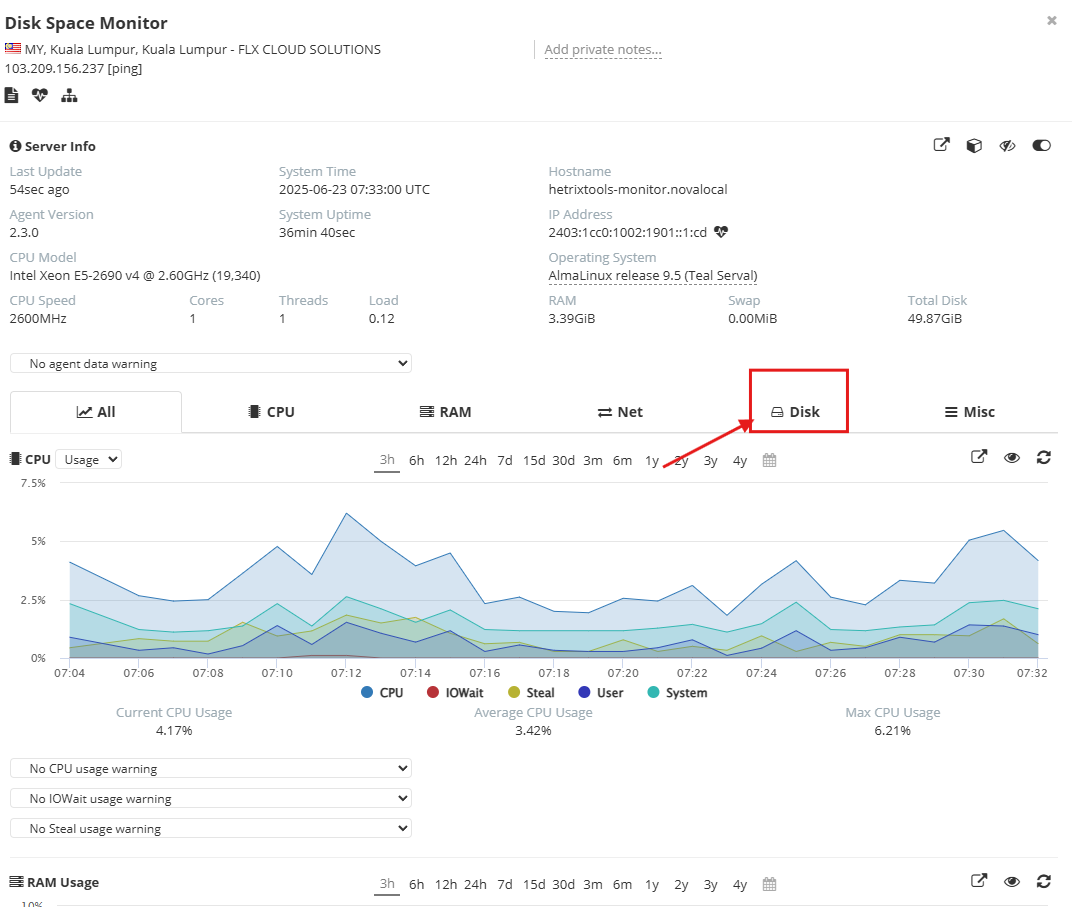
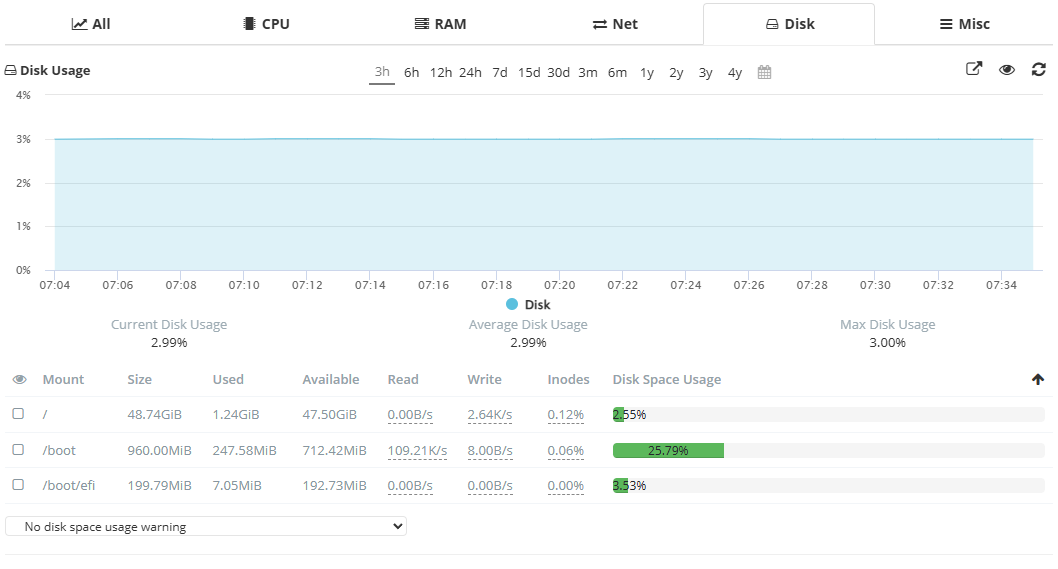
- For this case, you will need to navigate to Disk section to see the disk space monitor.
Step 4 – Set Notifications for Disk Failures
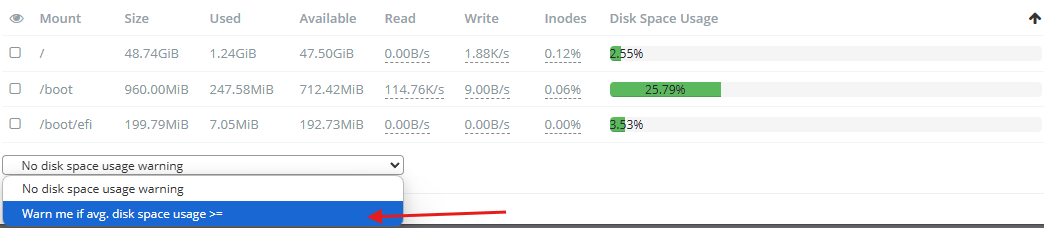
- To set notification, on the same page, navigate to the bottom.
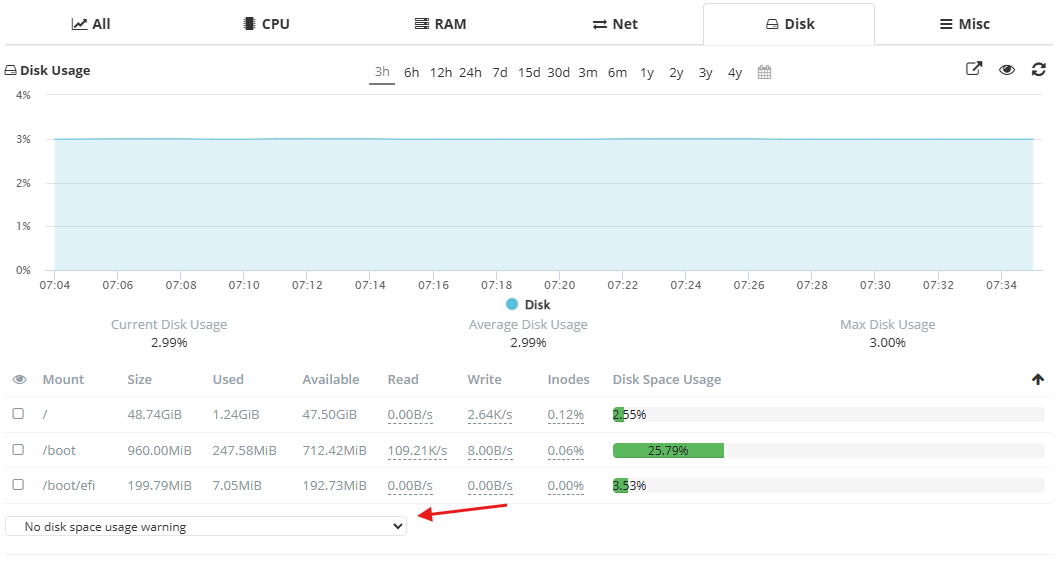
- Change the “No disk space usage warning” to “Warn me if avg. disk space usage >=”
- Set the following details:
- Average threshold %
- Usage average time
- Alert frequency
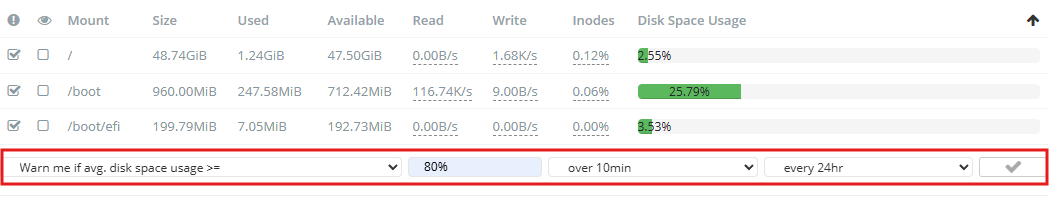
- Click the ✔️ icon, once completed.
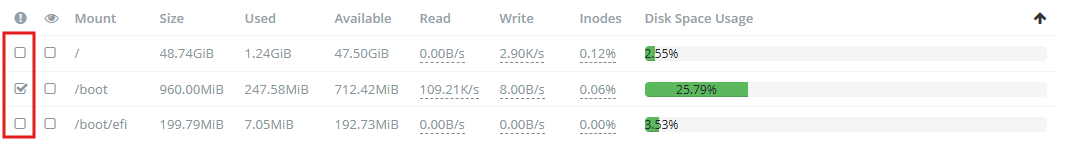
Optional Step – Select Specific Disks for Alerting
If your server has multiple mount points (e.g., / , /boot , /boot/efi), you can choose which disks to monitor for alerting.
As shown in the screenshot below, HetrixTools allows you to check or uncheck specific mount points:
Conclusion
With the HetrixTools agent and health monitoring in place, you’ll have a proactive view of both your server’s performance metrics and physical disk integrity. This setup helps reduce downtime by alerting you to critical storage issues like overheating, bad sectors, or nearing capacity — giving you time to act before the problem escalates.
Whether you’re managing a single VPS or a fleet of production machines, enabling disk health monitoring is a lightweight and highly valuable safeguard. Best of all, HetrixTools makes it easy to configure and customize exactly which partitions you care about — all through a clean, centralized dashboard.
For further assistance or troubleshooting, please contact support@ipserverone.com.