Search Our Database
How to Gain a Visual Understanding of your Spending Distribution in Customer Portal
Introduction:
For customers leveraging cloud services, maintaining efficient financial oversight is paramount. This guide is designed for Customer Portal users who require a concise, visual mechanism to monitor and analyze their recurring resource consumption.
Utilizing the NovaCloud Transactions interface, users can seamlessly generate a graphical breakdown of their spending. This process is essential for periodic financial reconciliation, allowing for proactive cost management and accurate resource allocation planning.
By navigating to the “OVERVIEW” tab within the Transactions section, users can access a monthly Charge Breakdown detailing expenditures across various services, including Volumes, Reserved IPs, Cloud Instances, Snapshots, and GPU Instances. The core objective of this process is met by utilizing the “VIEW AS CHART” button, which instantly translates these numerical charge details into an intuitive pie chart. This graphical presentation provides an immediate visual understanding of where points are being distributed across the deployed cloud infrastructure.
Prerequisites:
- Active Customer Portal Account.
- Active Utilization of IPSERVERONE Services.
Step-by-step Guide:
Step 1: Access NovaCloud Services
- On the left-hand navigation menu, locate and click on “NovaCloud”. This section provides access to all your cloud computing resources and services offered under NovaCloud.
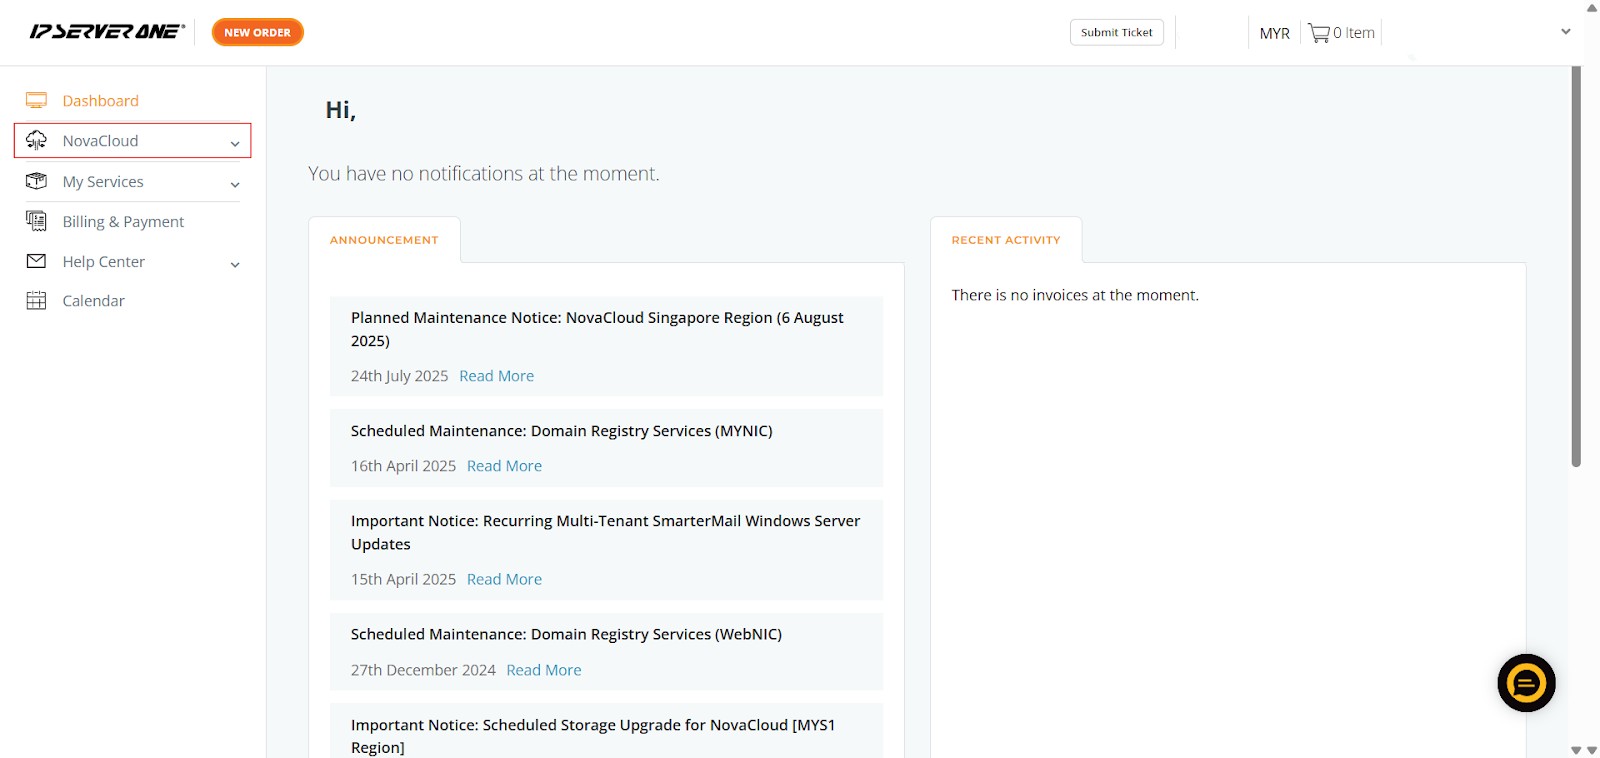
Step 2: Navigate to the Transactions Section
- From the expanded NovaCloud menu, scroll down and click on “Transactions”. This action will direct you to the dedicated transaction monitoring interface.
![]()
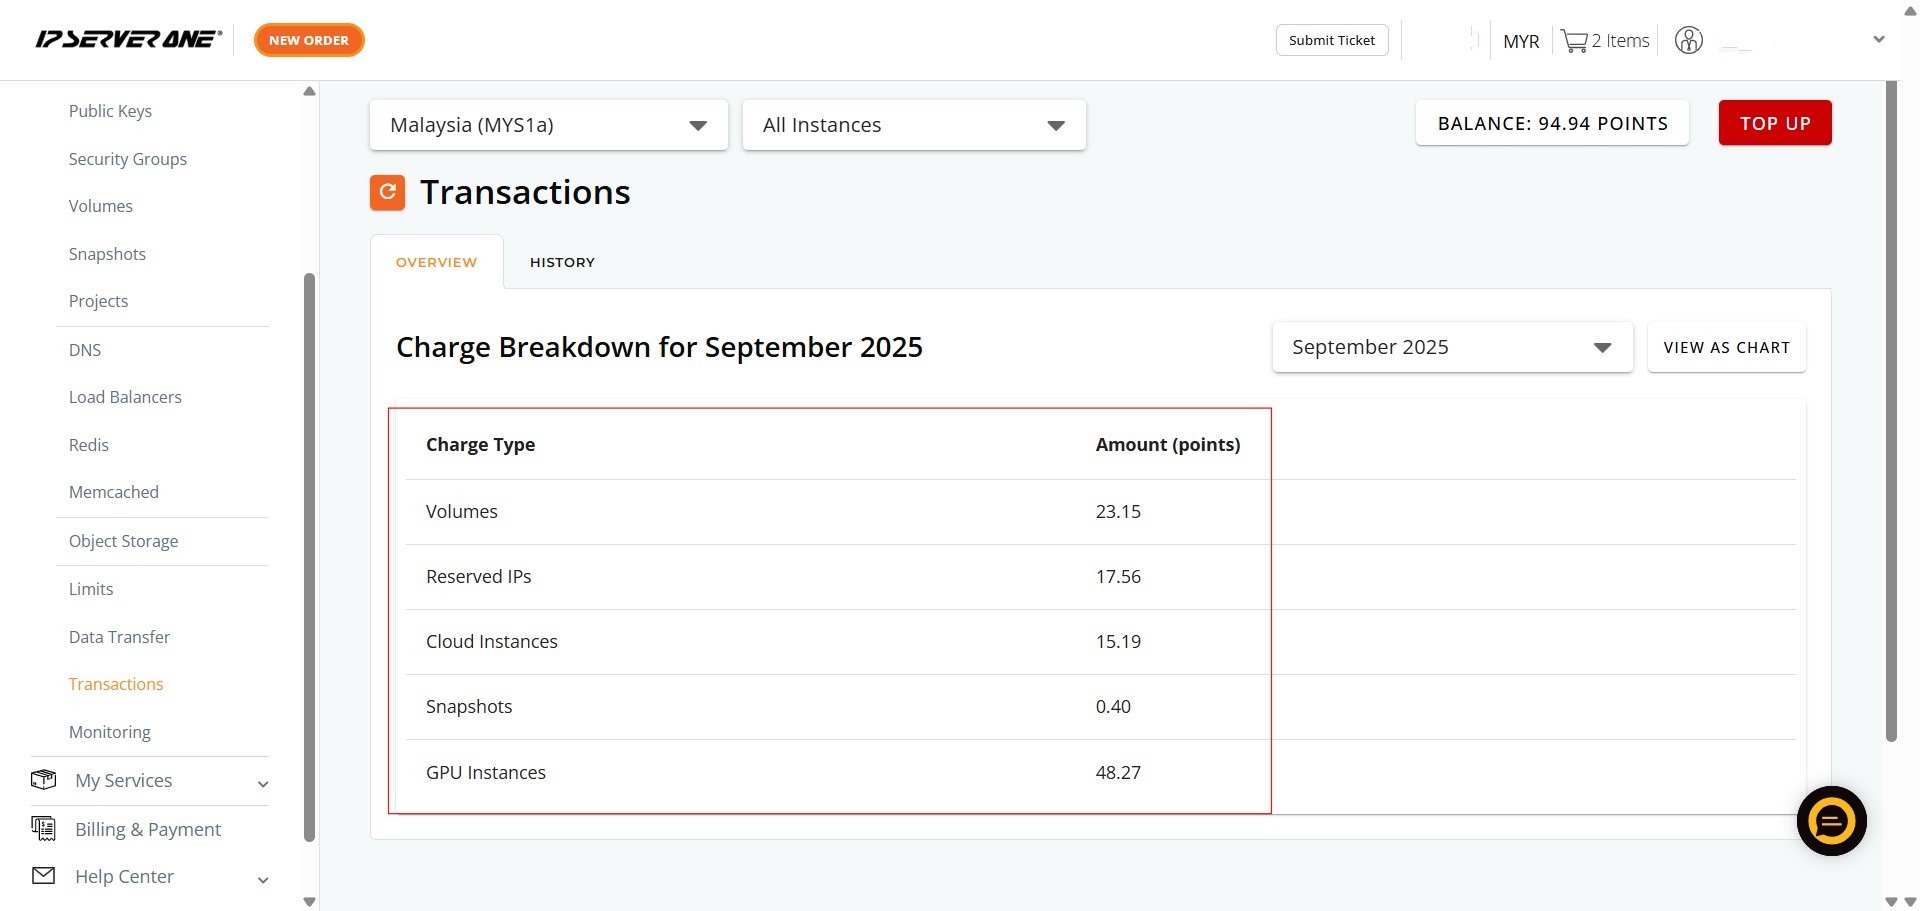
Step 3: Review Your Monthly Transaction Overview
- Upon entering the “Transactions” section, you will automatically be on the “OVERVIEW” tab.
- Here, you will see the “Charge Breakdown for [Current Month]”, which lists various Charge Types (e.g., Volumes, Reserved IPs, Cloud Instances, Snapshots, GPU Instances) and their corresponding Amount (points).
- This provides an immediate summary of your current month’s expenditures
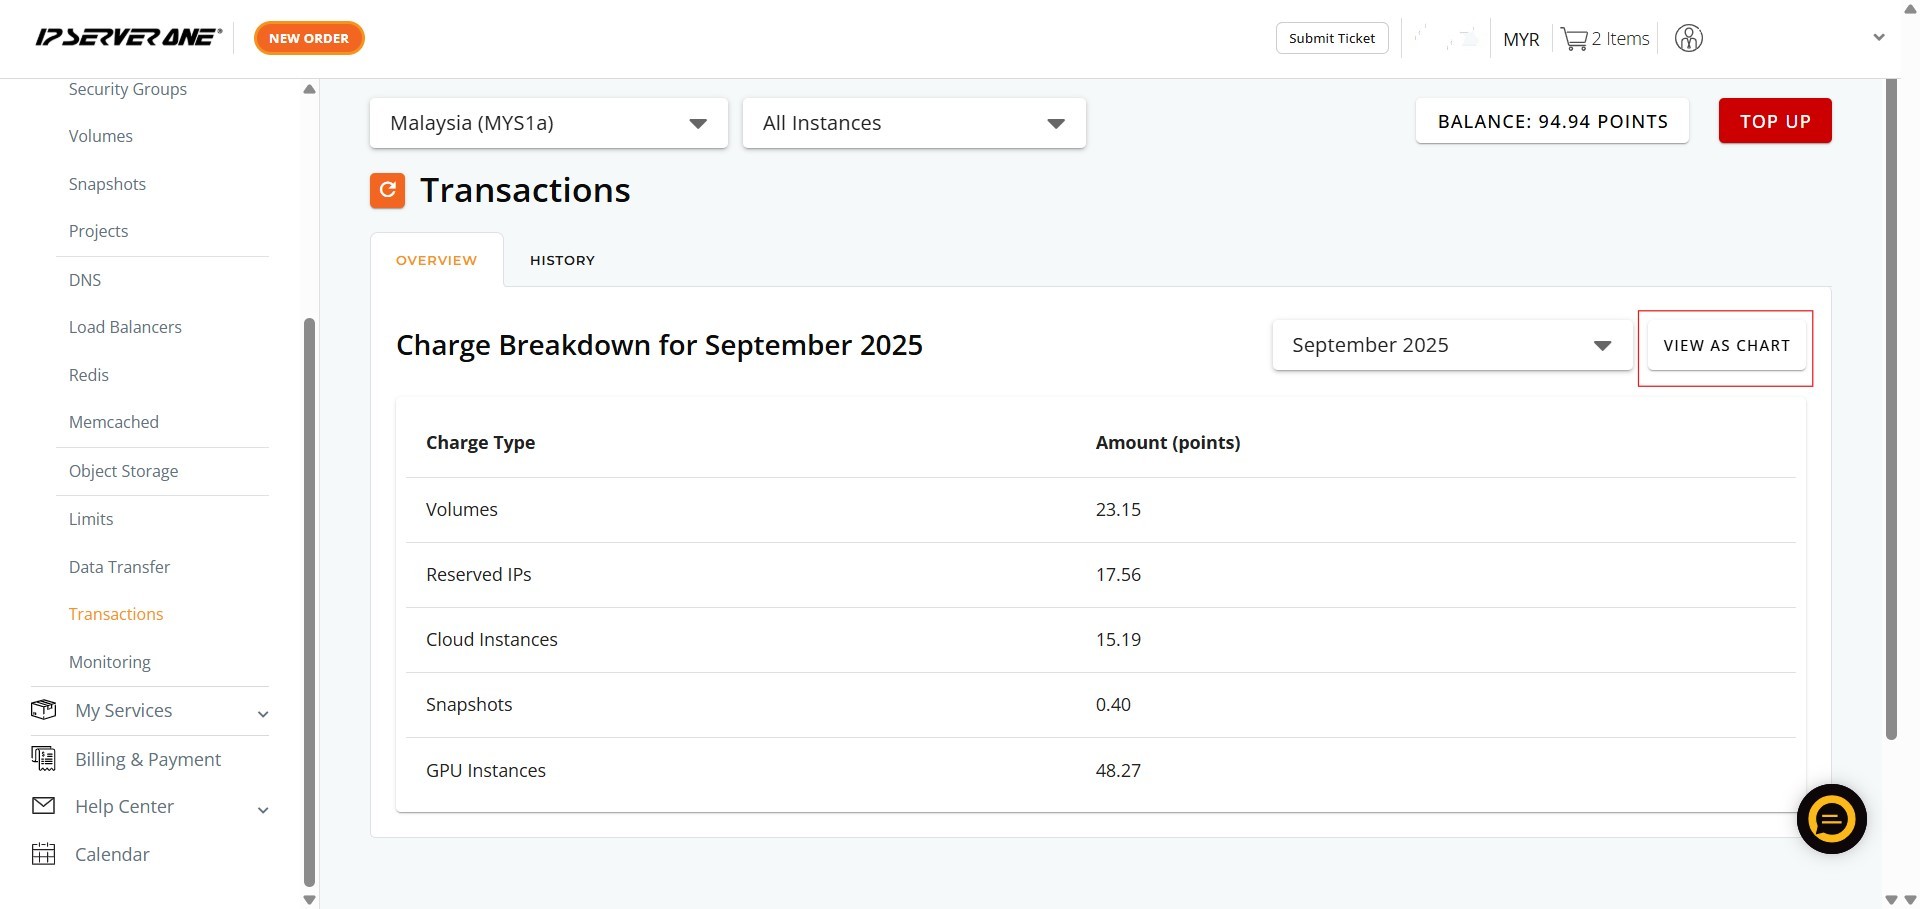
Step 4: View Spending as a Chart
- Locate and click the “VIEW AS CHART” button. This button is on the right side of the “Charge Breakdown for [Month]” section.
Step 5: View the Visual Breakdown
- A pop-up window titled “BREAKDOWN FOR [MONTH]” will appear, displaying your monthly charges as an intuitive pie chart. Hovering over segments of the chart will show specific charge types and amounts

Conclusion:
The successful implementation of the steps to View as Chart delivers an immediate, intuitive visual summary of your cloud resource consumption, effectively completing the goal of gaining a visual understanding of spending distribution.
By navigating to the NovaCloud Transactions area, you can easily access the “OVERVIEW” tab to generate a dynamic pie chart that breaks down specific monthly charges into categories like Volumes, Reserved IPs, Cloud Instances, Snapshots, and GPU Instances. This visual analysis tool is central to the comprehensive financial features available within the Customer Portal.
Should you encounter any issues or have any questions, our support team at IPSERVERONE is always here to assist you. Don’t hesitate to reach out to us at support@ipserverone.com for any help you need.